AUD/USD Price Analysis: Bears are moving in and eye a run to 0.72 the figure
- AUD/USD on the way to the 0.72 figure according to the daily chart analysis.
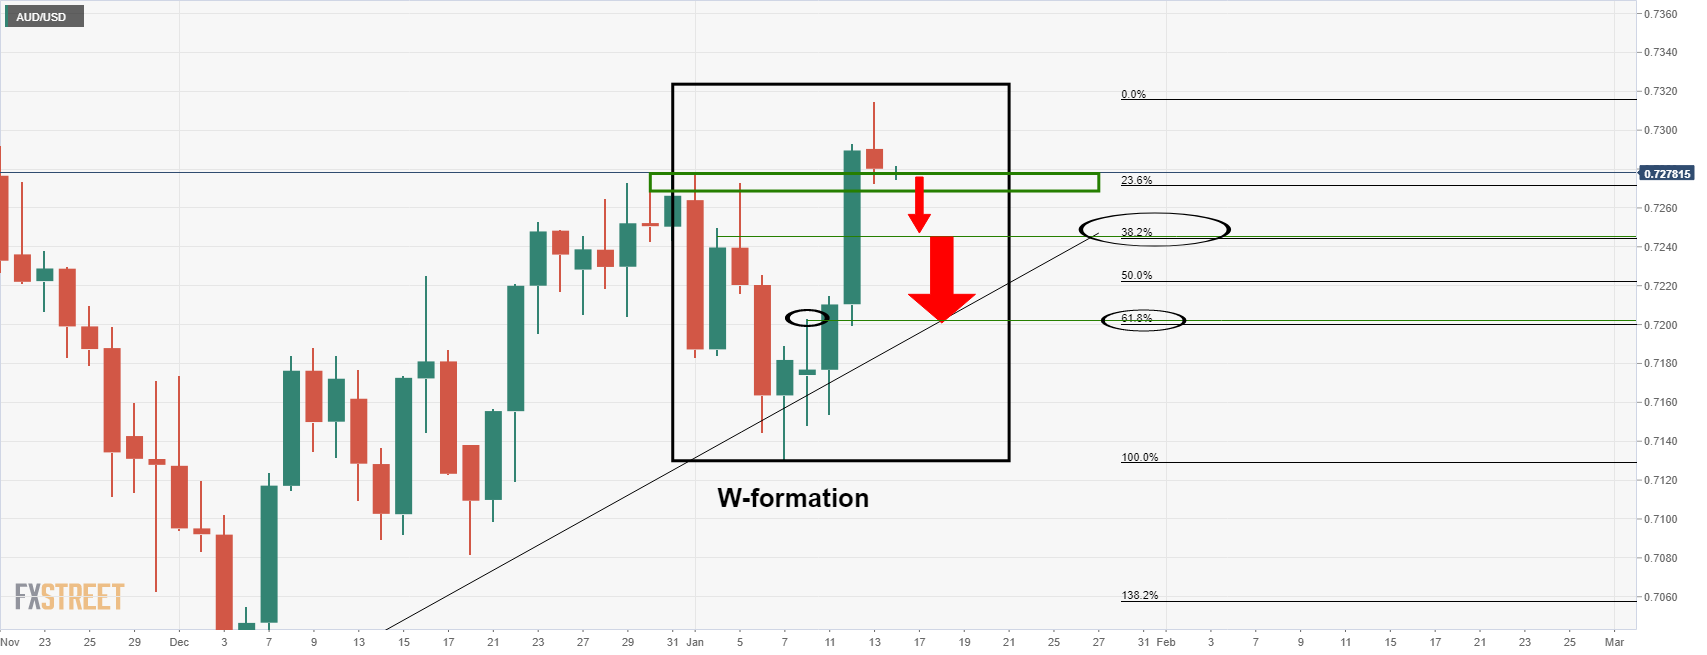
- Bears will note the confluence of the 38.2% and 61.8% Fibonacci levels.
As per the prior day's analysis, AUD/USD Price Analysis: Bears eye the daily chart's W-formation near 0.7235, the price is under pressure and the bears are on the verge of a break of key support.
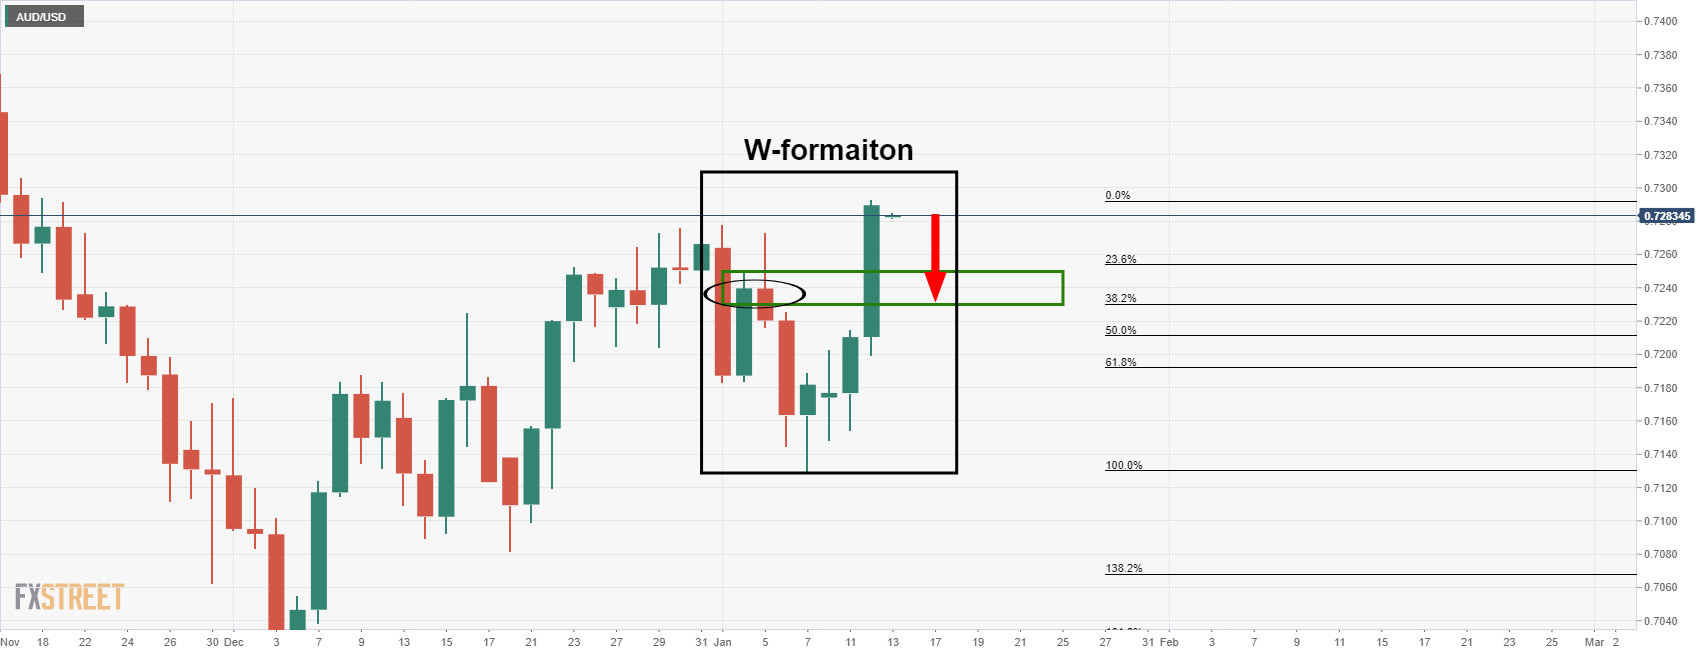
The price action since the prior analysis has moved in on the old resistance and a break there opens risk to the 38.2% Fibonacci and the neckline of the W-formation near 0.7250:
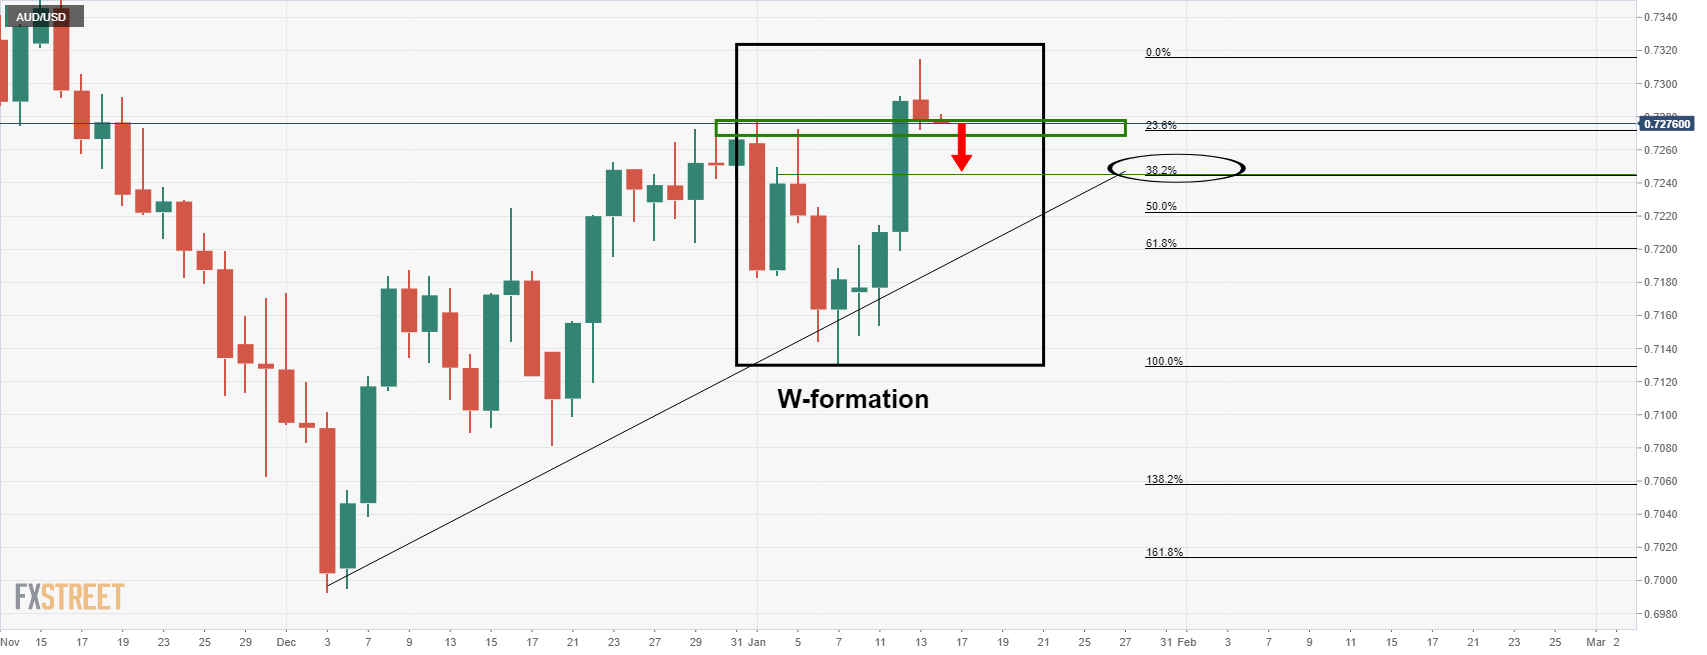
Below there, it can be argued that there is another W-formation, depending on the broker and close of the candle. However, it is a compelling level nonetheless as it meets the 0.72 figure and a confluence of the 61.8% Fibonacci level as follows:
Of course, this all depends on the direction of the greenback. Currently, it is on the back foot, but there are prospects of a correction and that could be enough to set off the Aussie bears:
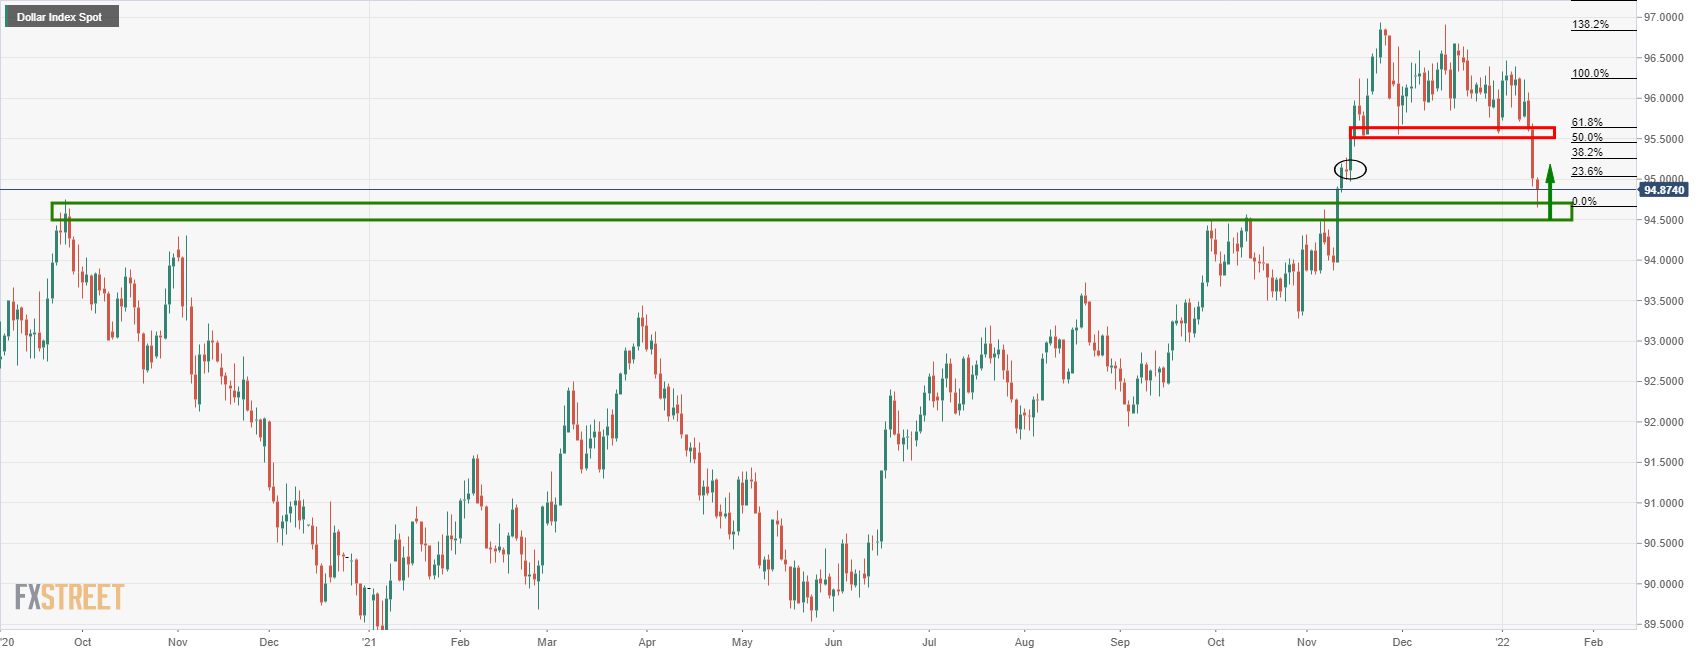
The DXY index, that measures the US dollar vs the basket of major currencies, including the Aussie, could be on the verge of a run to the 38.2% Fibonacci retracement. This could trigger a significant correction in AUD/USD.