USD/CAD Price Analysis: Bulls moving in for the kill, 38.2% Fibo 1.2550 eyed
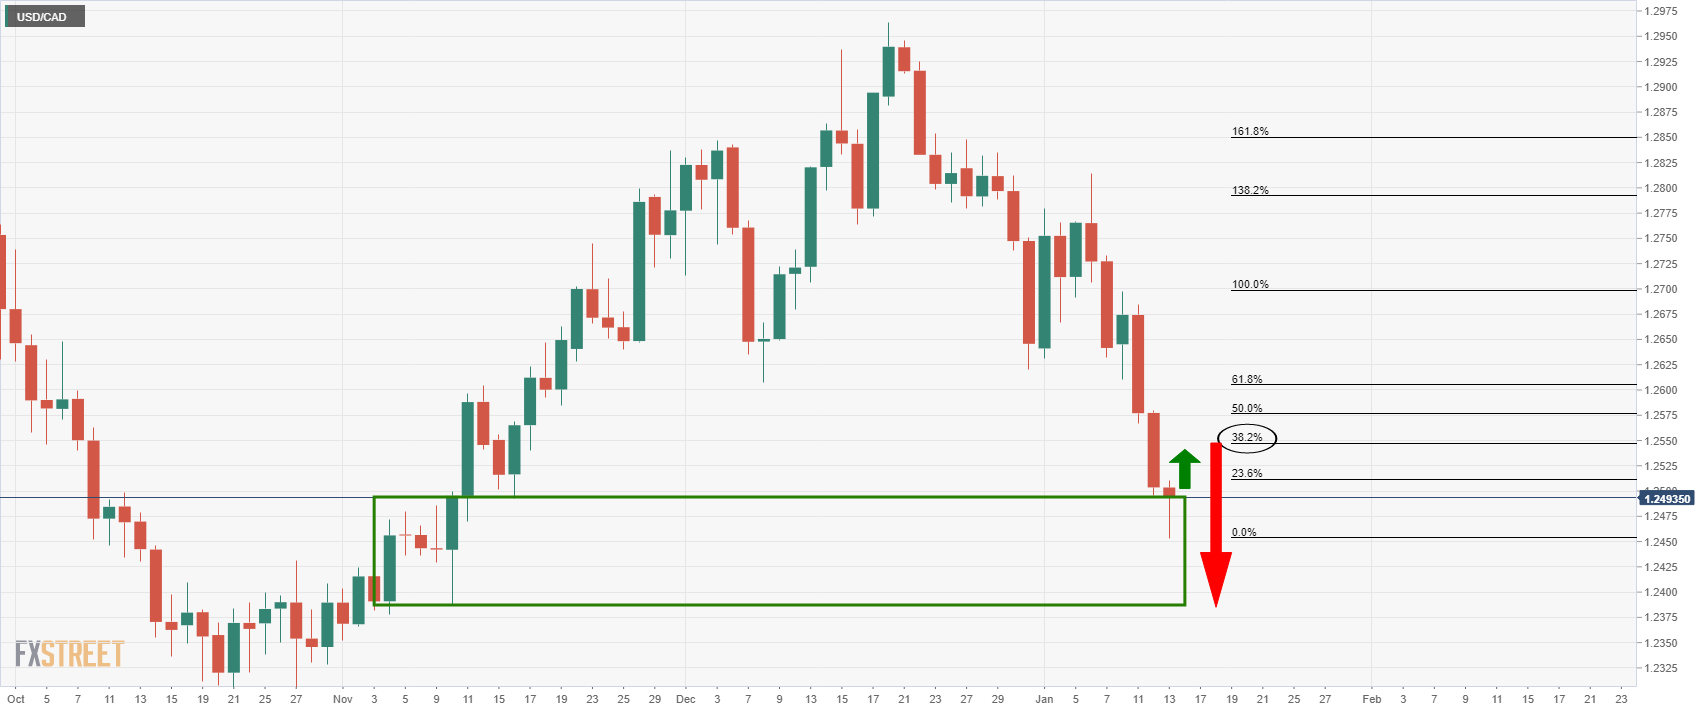
- USD/CAD bulls are stepping in at a demand area on the daily chart.
- The lower time frames offer structural targets at 1.2550 and 1.2580.
USD/CAD, following a break of the head and shoulders neckline as per prior analysis, USD/CAD Price Analysis: Bears to target 1.2480 on a breakout below daily H&S neckline, has started to stall in the decline.
While there is still every possibility that it can continue lower, a deeper correction could be on the cards as follows:
USD/CAD daily chart

The daily chart shows that the price has run into an area of demand and has stalled. This exposes the 38.2% Fibonacci retracement level near 1.2550 for the forthcoming sessions.
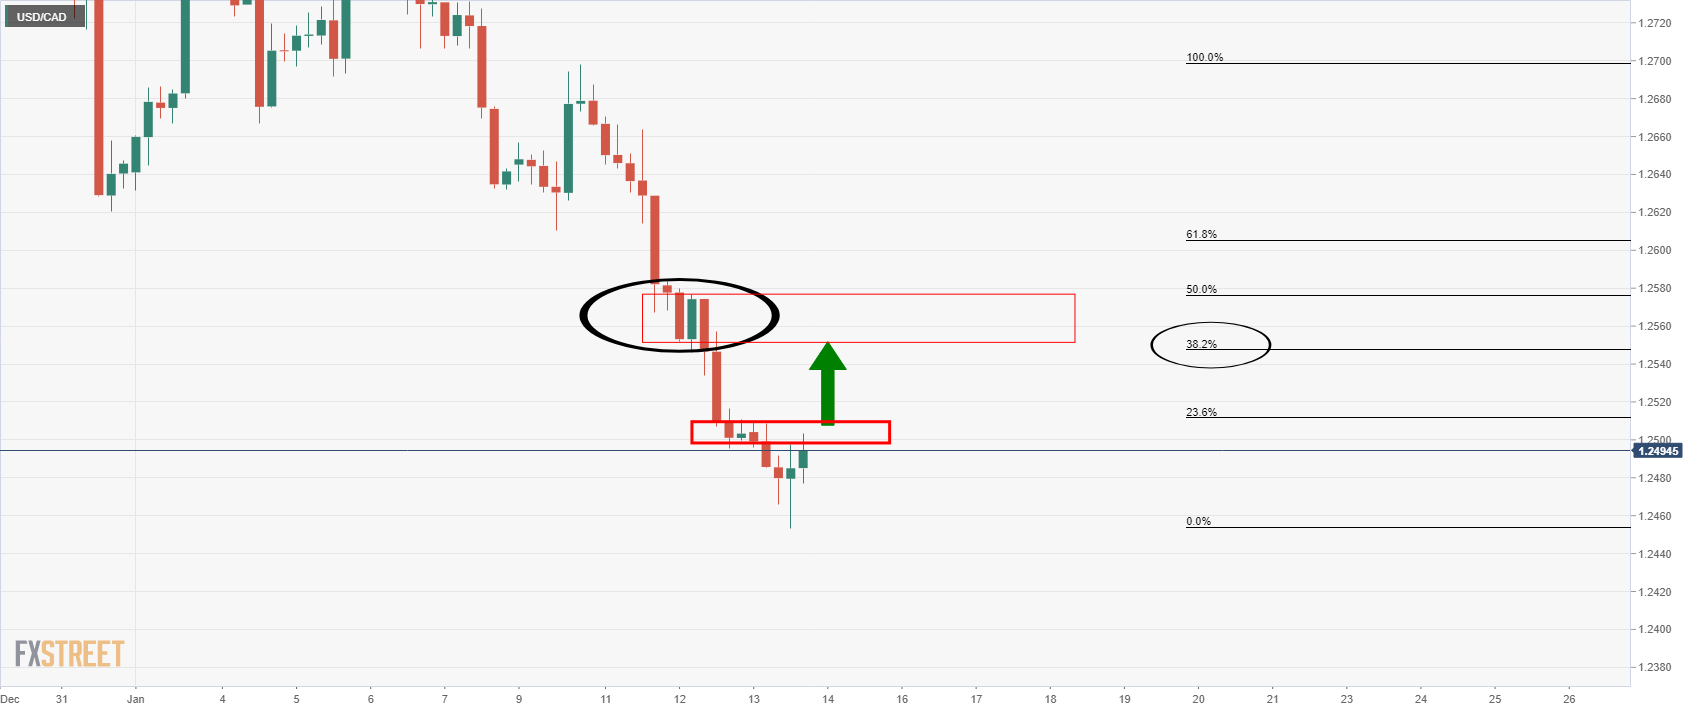
USD/CAD H4 chart

When moving down to the 4-hour time frame, we see that there was some demand in this area during the bearish run. In turn, we can expect the price to be drawn to this liquidity pool should the bulls manage to break the first layer of resistance around 1.25 the figure.
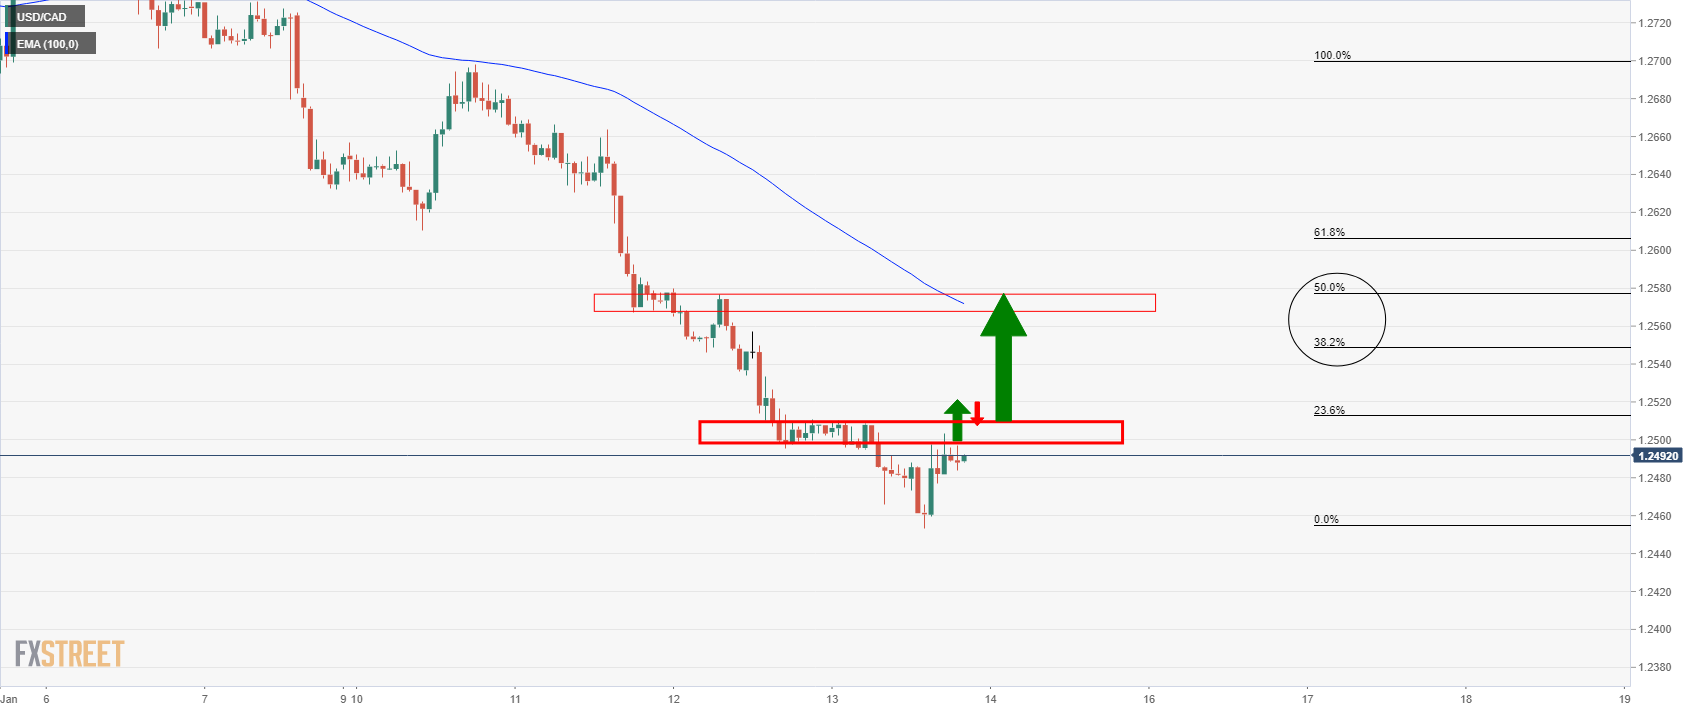
USD/CAD H1 chart

On the hourly time frame, the daily 50% mean reversion level comes in near hourly structure higher up around 1.2580 that currently has a confluence of the 100-hour EMA. If the bulls manage to clear 1.2550 and stay in control, this could be the next level of interest.
