GBP/USD Price Analysis: Flirts with ascending channel support, risks breaking below 1.3800
- Renewed USD strength prompted some selling around GBP/USD for the second successive day.
- The set-up has shifted in favour of bearish traders and supports prospects for further losses.
The GBP/USD pair struggled to capitalize on its modest intraday gains, instead met with some fresh supply near the 1.3855 region and turned lower for the second successive day on Tuesday.
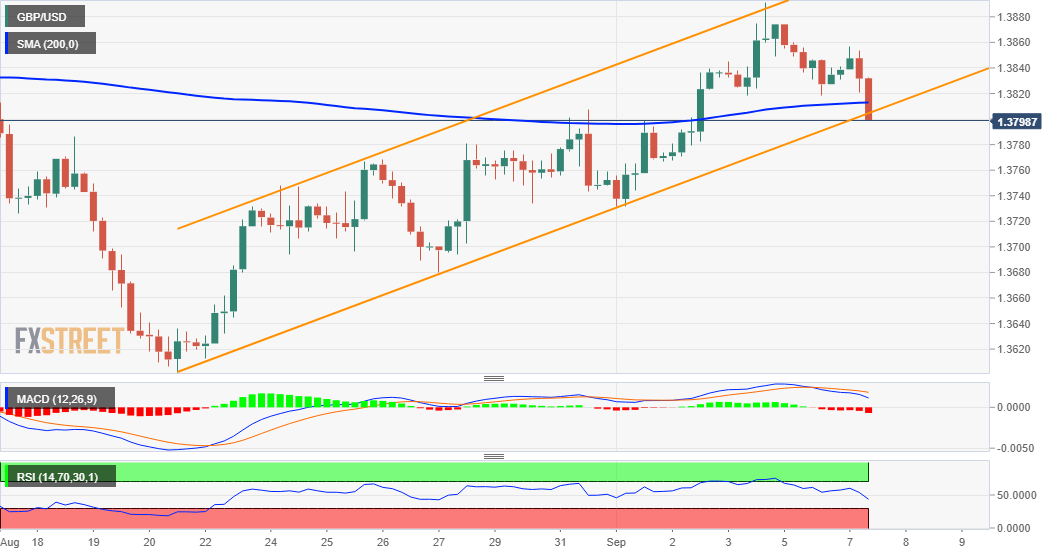
A strong follow-through positive move in the US Treasury bond yields acted as a tailwind for the US dollar. This, in turn, was seen as a key factor that dragged the GBP/USD pair to three-day lows, around the 1.3815-10 region during the first half of the European session. The mentioned area marks confluence support comprising of 200-period SMA on the 4-hour chart and the lower boundary of a short-term ascending channel extending from August monthly swing lows. This, in turn, should now act as a key pivotal point for short-term traders.
Meanwhile, technical indicators on hourly charts have started drifting into bearish territory and losing positive momentum on the daily chart. Hence, a convincing break below the 1.3810-15 confluence will mark a bearish breakdown and prompt aggressive technical selling. Some follow-through selling below the 1.3800 mark will reaffirm the negative outlook and turn the GBP/USD pair vulnerable to extend its retracement slide from the 1.3900 neighbourhood. The next relevant support is pegged near the 1.3740-35 area ahead of the 1.3700 mark.
On the flip side, the 1.3855-60 region now seems to have emerged as an immediate strong resistance, above which bulls could aim to challenge the trend-channel resistance. The latter is currently pegged near the 1.3900 mark, which if cleared should set the stage for further gains. The GBP/USD pair might then accelerate the momentum further towards the 1.3950-55 intermediate hurdle, en-route the key 1.4000 psychological mark.
GBP/USD 4-hour chart
Technical levels to watch