WTI Price Analysis: Eyes recovery of post-API losses above $41.00
- WTI bounces of $41.45 after bulls step back from $42.52, the fresh high since March 06.
- US API Weekly Crude Oil Stock surged beyond -8.322M prior to 7.544M.
- Last Wednesday’s top offer immediate support, buyers can aim for six-week-old resistance line.
- Bullish MACD confronts pullback in oversold RSI conditions.
WTI extends pullback from $41.45 to $41.59 during the early Asian session on Wednesday. The energy benchmark rose to a multi-year high the previous day, before consolidating on the weekly private inventory data from the American Petroleum Institute (API).
The US API Weekly Crude Oil Stock for the period ended on July 17 grew 7.544 million barrels versus the previous depletion of 8.322 million barrels.
Following the price-negative news, overbought RSI conditions played their roles to pull the quote back to a one-week low. However, bullish MACD and the resistance-turned-support keep the bulls hopeful above $41.45/37 horizontal area.
Hence, the oil buyers may again target $42.00 and the recent tops near $42.50 during the further rise. Though, an upward sloping trend line from June 07, currently near $43.50, followed by February month low near $44.00, might challenge the black gold’s further upside.
Meanwhile, sellers’ dominance past-$41.37 will attack $41.00 and the monthly support line, currently around $40.00. It should, however, be noted that the commodity’s further declines below $40.00 will aim for the monthly bottom around $38.70.
WTI four-hour chart
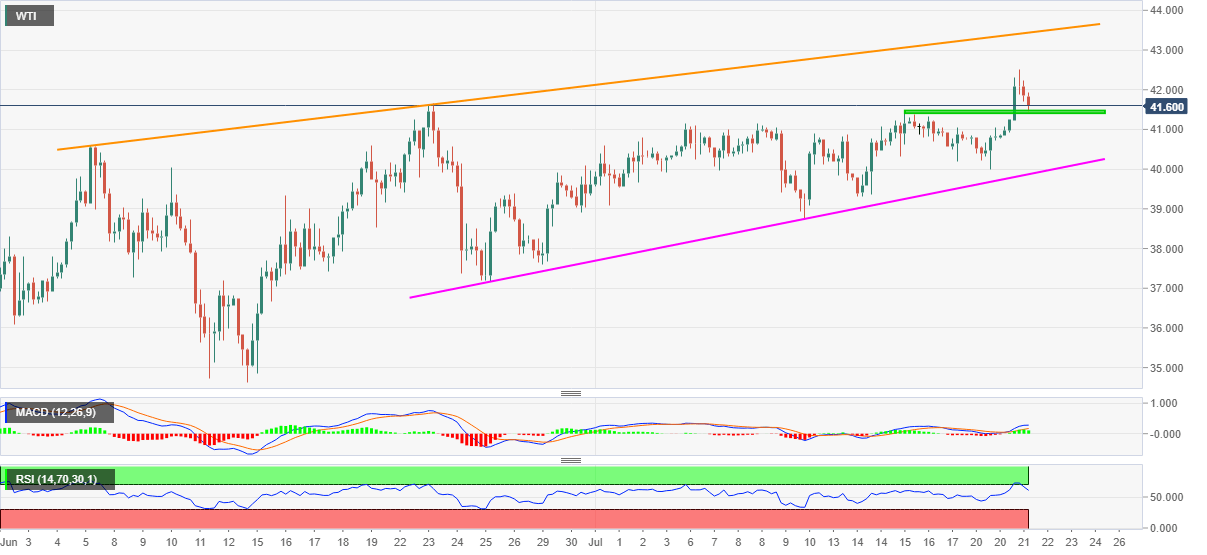
Trend: Pullback expected