S&P 500 Price Analysis: 4-HR bearish divergence in momentum, yet bulls remain on control
- Bulls remain on control above a critical support structure, targeting all-time highs.
- To the downside, a break below structure could open prospects for a waterfall bear-trend.
- A 4-HR momentum strategy might be regarded as plausible at such a juncture.
The S&P 500 Index made a fresh recovery high and the highest level since February. Investors remain optimistic over the race for a Covid-19 vaccine.
-
Wall Street Close: S&P 500 ekes out the highest level since Feb on tech stock surge
From a technical perspective, there is something for both bears and bulls to take from the charts.
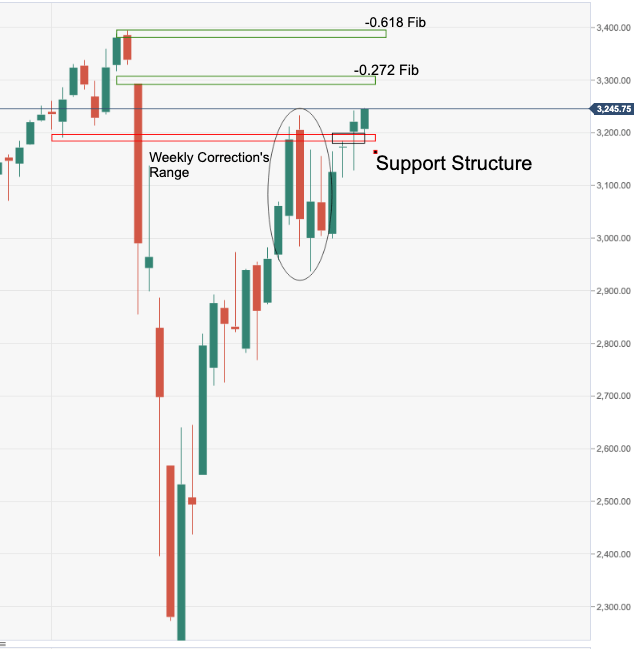
Specifically, on the daily chart, we are seeing price holding acutely above a recently formed support structure as follows:
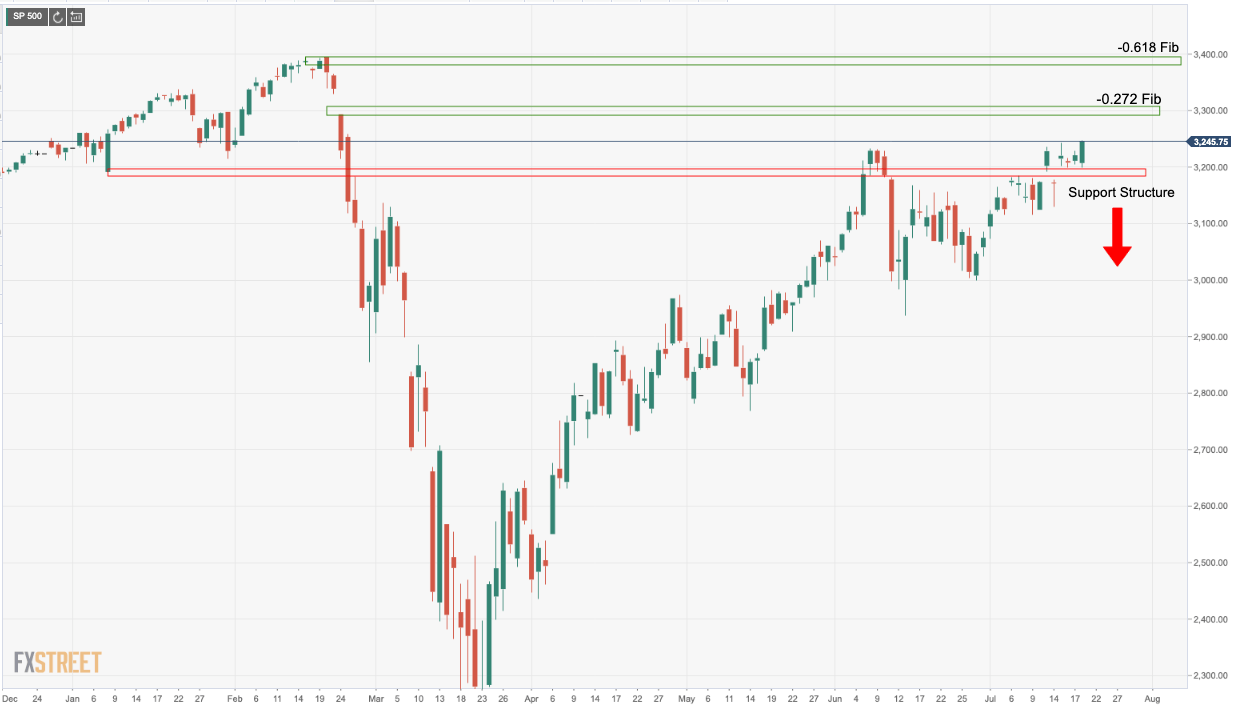
While holding above here, bulls can target a series of upside Fibonaccis of the prior weekly correction's range, namely the -0.272 or the higher -0.618.
Meanwhile, the case for the downside is explained more deeply in the following article from the start of this week:
- S&P 500 Index Weekly Forecast: Nothing but blue skies from now on?
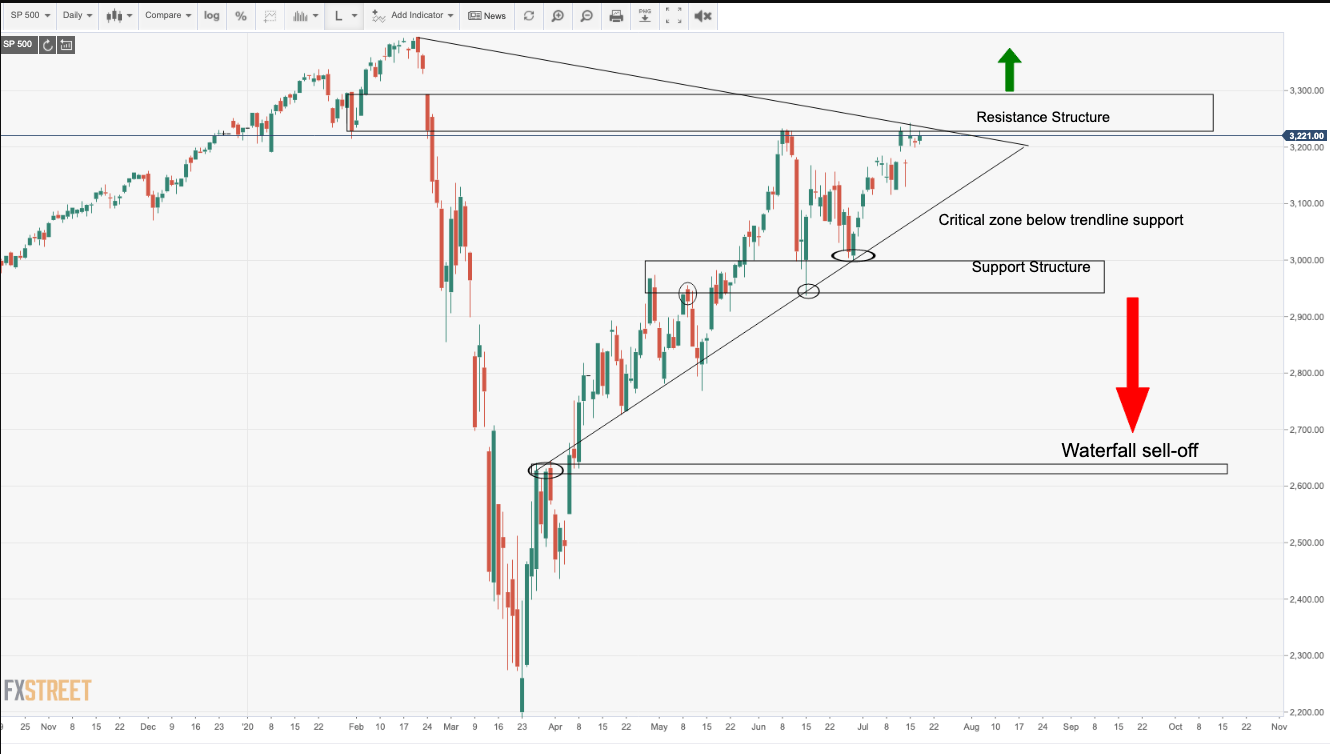
In the above chart, it illustrates how crucial the trendline support is of the symmetrical triangle formation.
Below the Support-Structure opens the prospects of a waterfall style sell-off towards a prior W-formation support level that could act as the last defence.
However, on the upside, so long as the 2020 trendline support holds up, a buy the dips playbook could be the way to go, especially on a break of drawn resistance and subsequent re-tests and holds above the structure.
Divergence strategy
A divergence strategy might be applied for bears looking for a set-up as follows, taking the 4-HR chart's divergence as a placement:
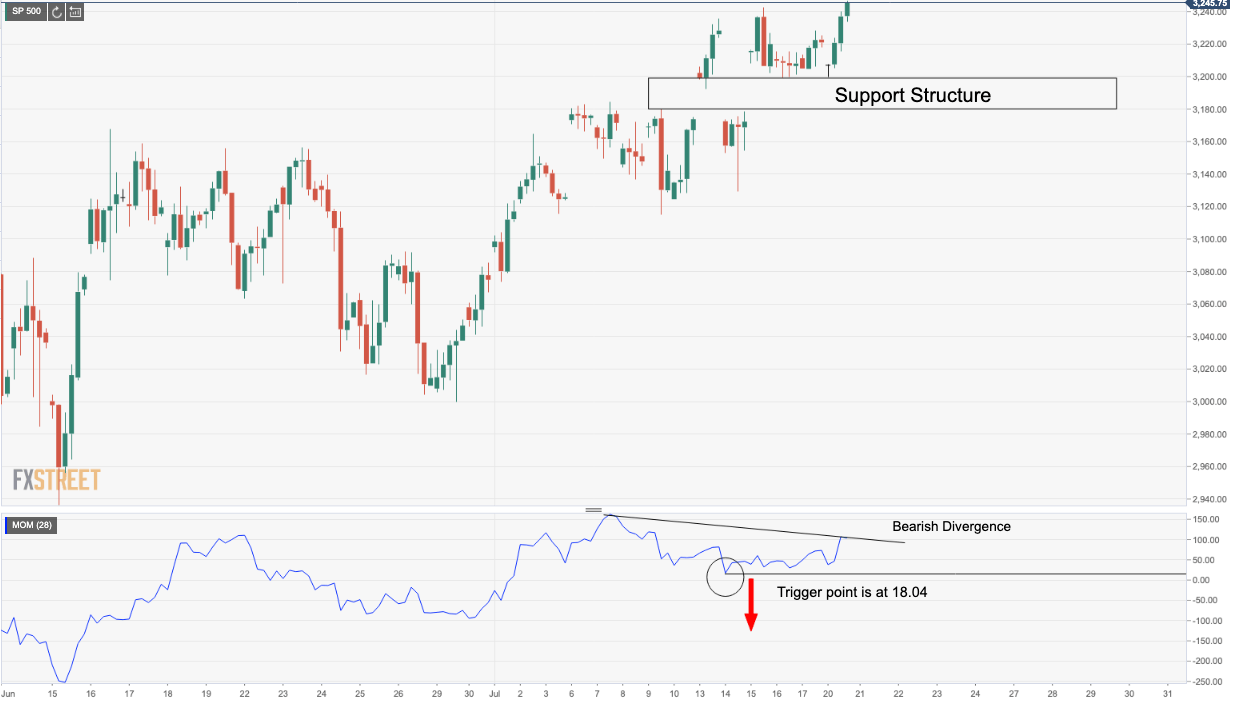
Should momentum break the eclipsed point of Momentum 28 on the above chart, this could signal a bearish entry point, so long as the price is back below the Support Structure, preferably following a failure of a retest of the same structure.