Gold Price Analysis: Pressured below $1,550 as MACD teases the bears
- Gold prices fail to clear the weekly resistance line.
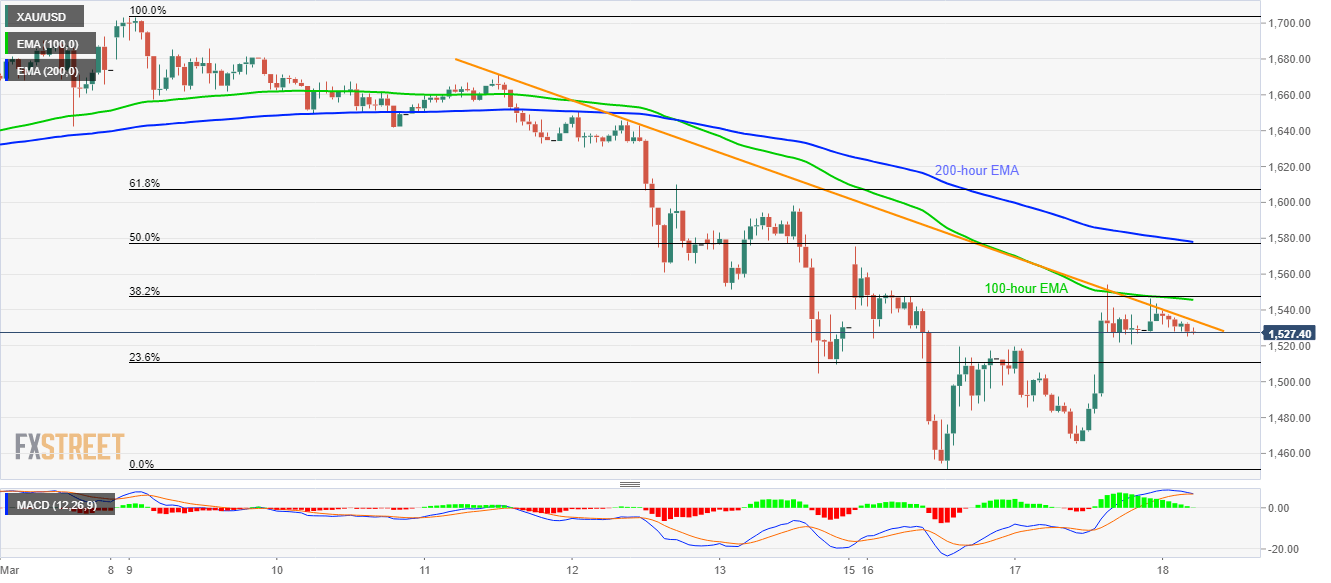
- 100-hour EMA, 38.2% Fibonacci retracement add to the upside barriers.
- Sellers will look for entry below 23.6% Fibonacci retracement, will target November 2019 low in that case.
Gold prices ease further below $1,550 to $1,528.70 during the pre-European session on Wednesday. In doing so the bullion takes U-turn from one-week-old resistance line amid MACD edging closer to the bearish signals.
That said, sellers will look for entry below 23.6% Fibonacci retracement level of March 09-16 fall, at $1,510, whereas the recent low near $1,451 and November 2019 bottom close to $1,445 could lure the bears next.
It should, however, be noted that the precious metal’s extended declines below $1,445 will make it vulnerable to revisit August 2019 low near 1,400.
Alternatively, a confluence of 100-hour EMA and 38.2% Fibonacci retracement close to $1,546/48 will offer an additional filter to the upside moves past-$1,535, comprising the aforementioned resistance line.
During the price rally beyond $1,548, 200-hour EMA and 50% of Fibonacci retracement near $1,578 will be the key to watch.
Gold hourly chart
Trend: Bearish