USD/JPY Price Analysis: Carries gains from 100-hour SMA support
- USD/JPY holds onto recovery gains from key SMA, short-term horizontal support.
- A two-day-old falling trend line limits immediate upside, 200-hour SMA adds to the support.
- Technical indicators suggest further recovery.
USD/JPY takes the bids to 109.84 during the early trading hours of Monday. The pair recently bounced off 100-hour SMA, not to mention a four-day-old horizontal line.
In addition to the pair’s sustained bounce off the near-term key supports, upbeat conditions of RSI and MACD also favor the further recovery of USD/JPY prices.
As a result, the quote currently rises to a two-day-old descending resistance line, at 109.95, ahead of challenging the yearly top surrounding 110.30.
Meanwhile, the pair’s declines below 100-hour SMA and immediate horizontal line, around 109.65 and 109.50 respectively, can recall 109.30 to the charts.
However, 200-hour SMA and 61.8% Fibonacci retracement of January 31 to February 06 upside, near 109.20 and 108.95 in that order, will question the bears afterward.
USD/JPY hourly chart
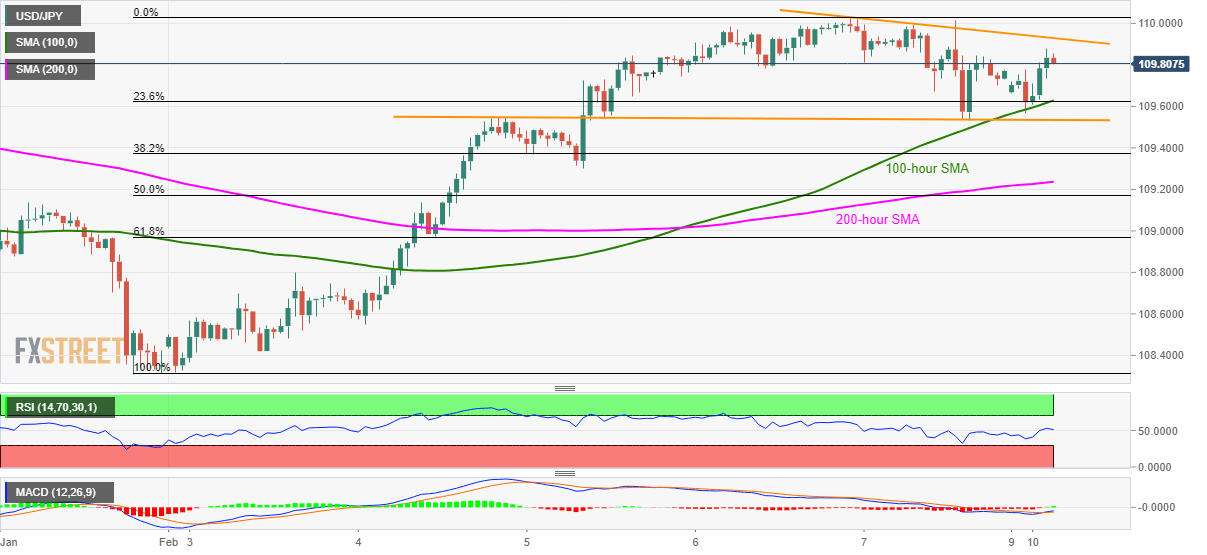
Trend: Bullish