EUR/USD Price Analysis: Likely to bounce off 61.8% Fibonacci
- EUR/USD struggles around the key Fibonacci retracement amid bullish MACD.
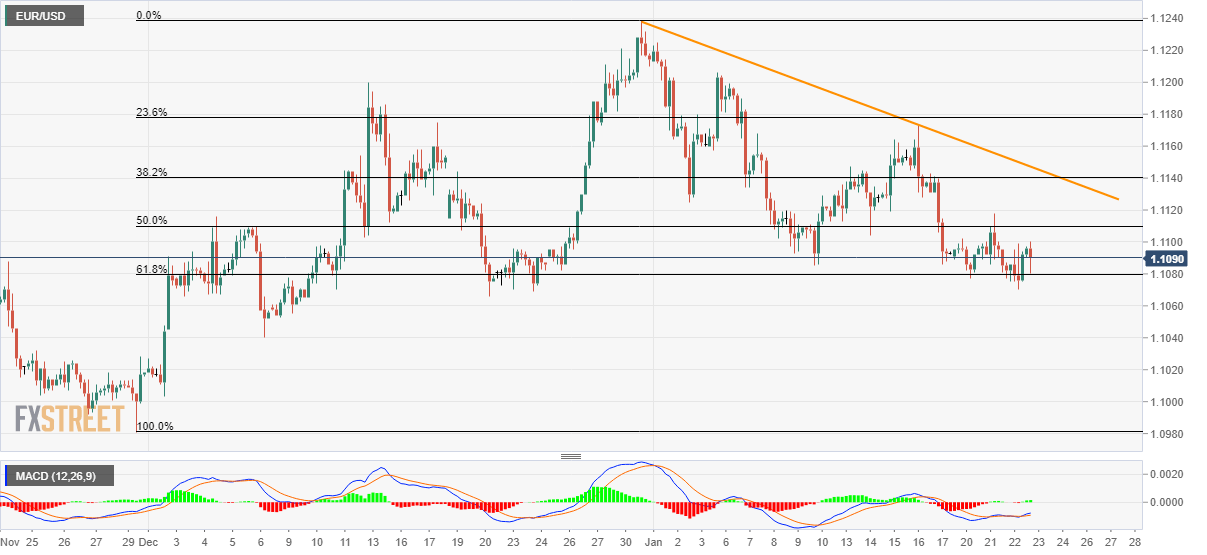
- Prices have registered multiple failures to slip beneath 61.8% Fibonacci since December 20.
- The monthly falling trend line can cap the recovery.
EUR/USD reverses the early-Asian pullback while declining to 1.1090 during Thursday. While considering the latest pullback, it seems to be clear that the pair respects 61.8% Fibonacci retracement of November 29 to December 31, 2018, upside as the strong support. Also favoring the odds of a U-turn are bullish signals from MACD.
With this, 50% and 38.2% Fibonacci retracement level of 1.1110 and 1.1140 gain the market’s attention.
However, a downward sloping trend line since December 31, at 1.1147, will restrict the pair’s recovery afterward, if not then 1.1200 will lure the bulls.
Meanwhile, a clear downside past-61.8% Fibonacci retracement level of 1.1079 can recall 1.1025 and 1.1000 on the charts.
During the pair’s extended south-run below 1.1000, 1.0980 and the yearly bottom of 2019 near 1.0880 will be in focus.
EUR/USD four hour chart
Trend: Pullback expected