Back
17 Jan 2020
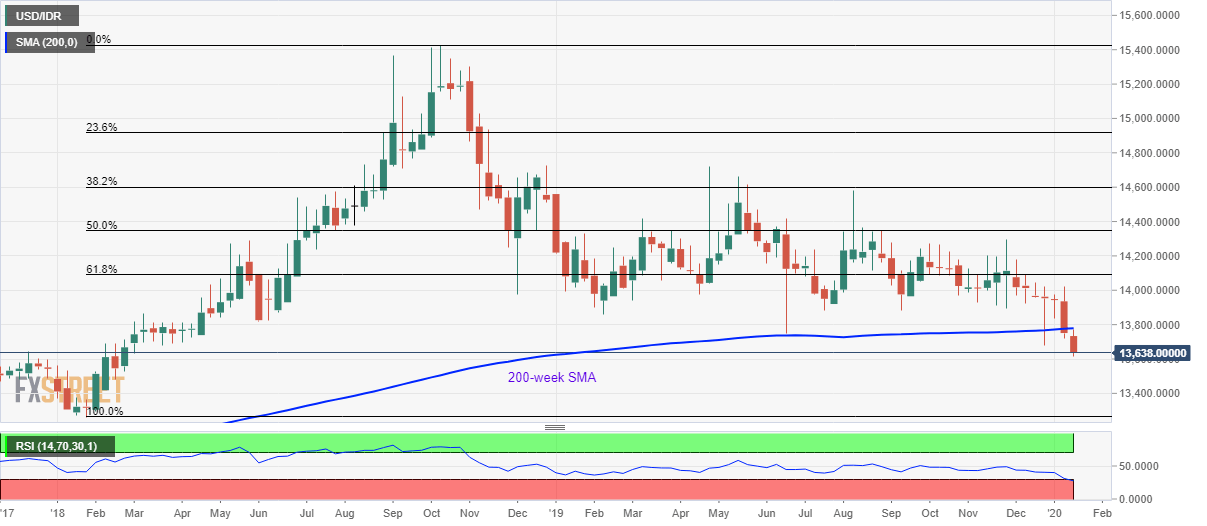
USD/IDR Price Analysis: Break of 200-week SMA pushes sellers towards January 2018 low
- USD/IDR trades near the lowest since February 2018.
- 61.8% Fibonacci retracement level of pair’s 2018 run-up adds to the resistance.
USD/IDR extends its fall to 13,650 during Friday’s Asian session. The pair recently slipped below 200-week SMA for the first time since the year 2012.
As a result, sellers can anticipate further downpour. In doing so, prices can take rest on 13,500 and 13,380 supports ahead of visiting the year 2018 low surrounding 13,260.
It should also be noted that the pair’s declines below 13,260 might not hesitate to question 13,000 psychological mark.
Alternatively, 61.8% Fibonacci retracement of the pair’s rise in the year 2018, at 14,090, can question buyers above a 200-week SMA level of 13,780.
USD/IDR weekly chart
Trend: Bearish