Back
31 Dec 2019
USD/IDR Technical Analysis: Three-year-old rising trendline in focus
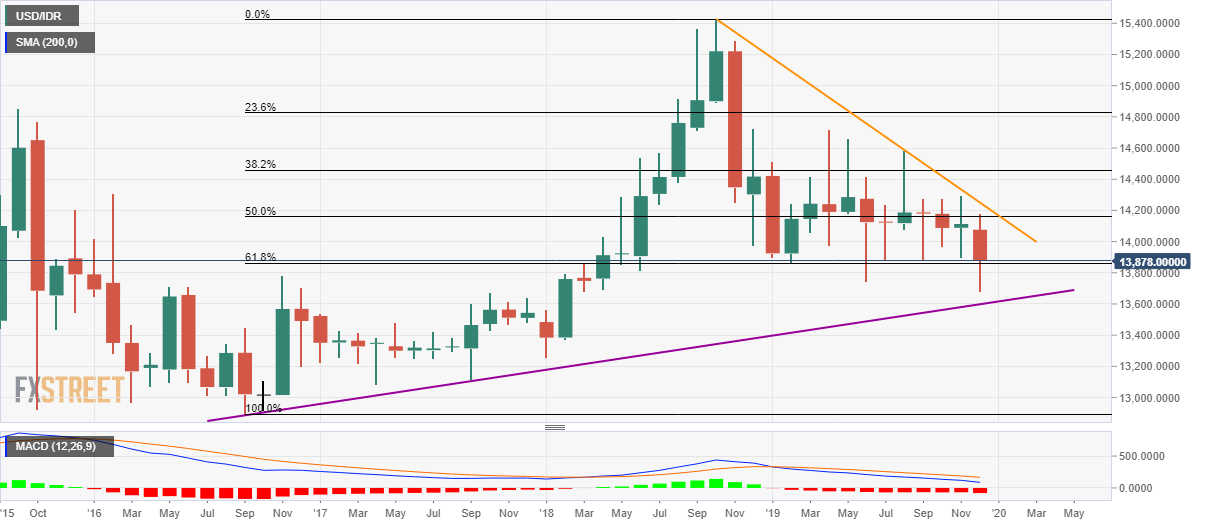
- USD/IDR seesaws around 61.8% Fibonacci retracement of 2016/18 upside.
- Bearish MACD, failure to carry the previous month’s recovery indicate further declines.
USD/IDR remains under pressure while trading around 13,870 during the pre-European session on Tuesday. The pair recently slipped beneath 61.8% Fibonacci retracement of longer-term upside and hence a monthly close will be closely observed for further direction.
On a monthly close below 61.8% Fibonacci retracement of 13,860, the pair could aim for the three-year-old ascending support line, at 13,600.
If at all bearish histogram of MACD drags the quote well below 13,600, May 2017 high near 13,490 will be in the spotlight.
Alternatively, bulls will refrain from entry unless breaking a 14-month long descending trend line, at 14,250 now.
However, a sustained break of 14,250 will propel prices to yearly top nearing 14,720.
USD/IDR monthly chart

Trend: Bearish
