Back
2 Dec 2019
EUR/USD Technical Analysis: Fiber rolling into Asia near 1.1080 level
- EUR/USD started December with a strong bullish breakout.
- The level to beat for buyers is the 1.1110 resistance.
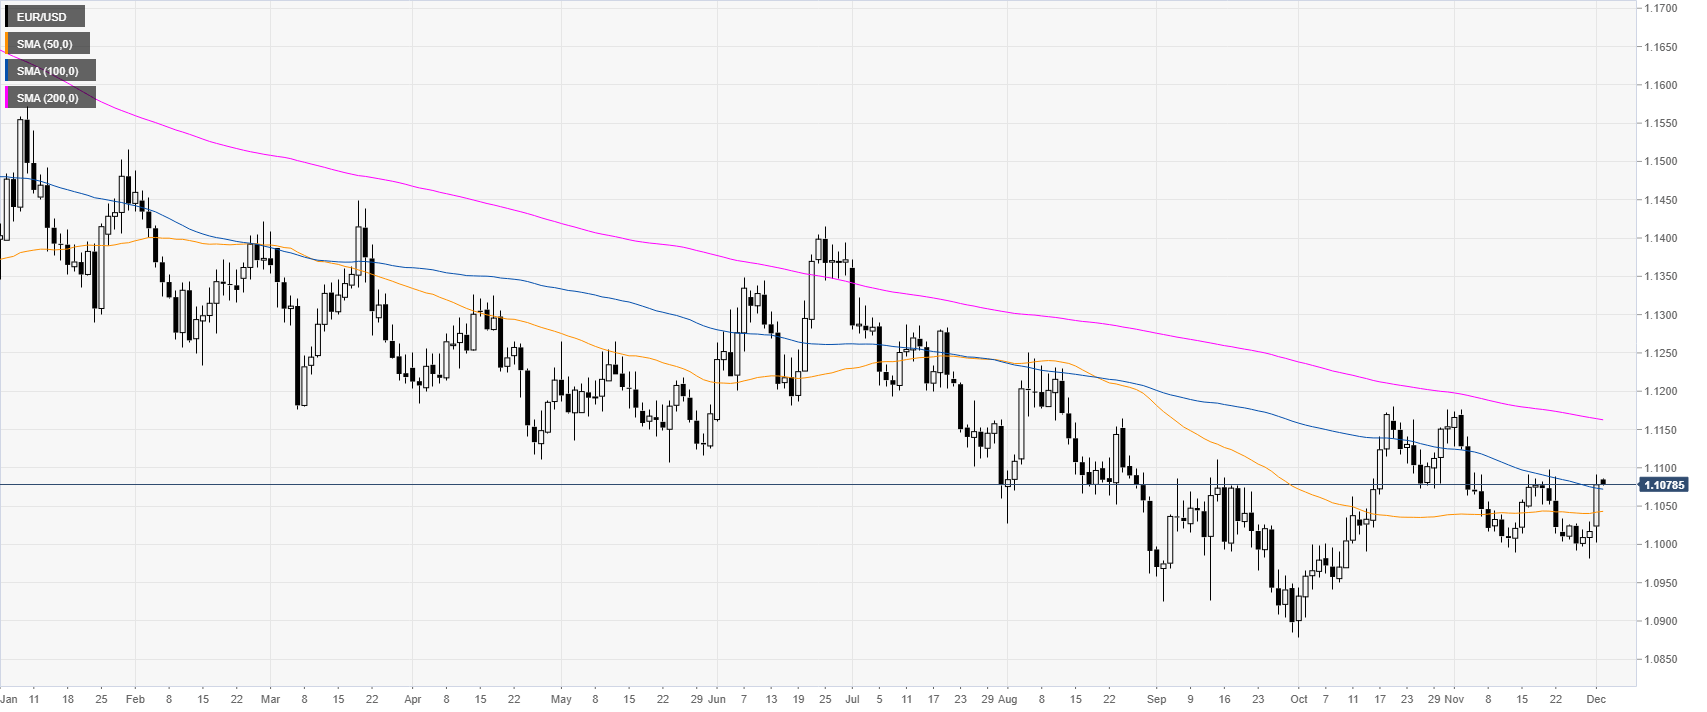
EUR/USD daily chart
EUR/USD currency pair, on the daily time frame, is trading in a bear trend below the 200-day simple moving averages (DMAs). However, this Monday, the market had a strong reversal up above the 1.1000 handle and the 50/100 SMA.
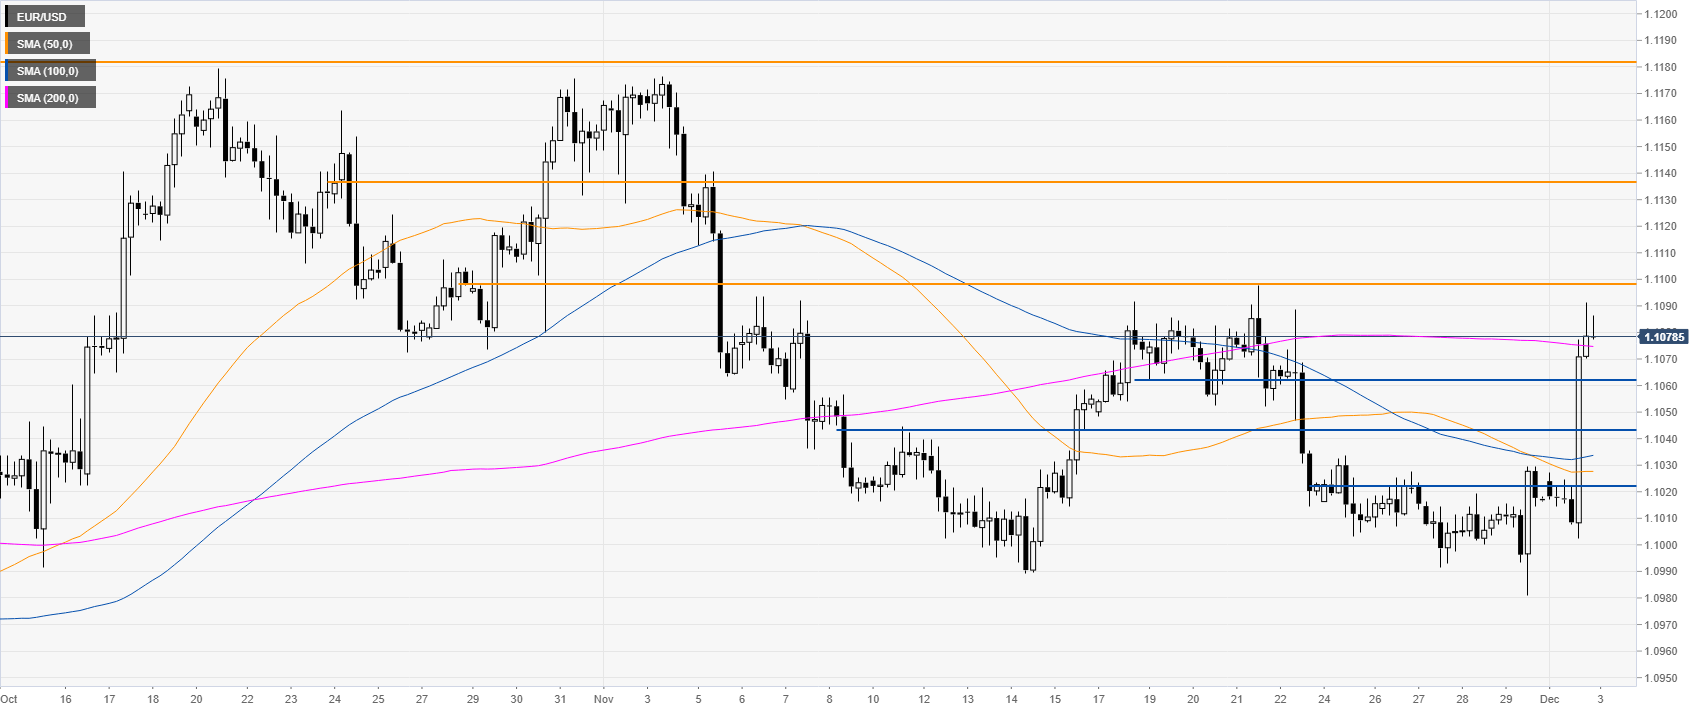
EUR/USD four-hour chart
EUR/USD is approaching the1.1100 resistance while challenging the 200 SMA on the 4-hour chart. The buyers have likely taken control and if 1.1100 is taken out, the market can advance towards the 1.1137 and 1.1180 resistances, according to the Technical Confluences Indicator.
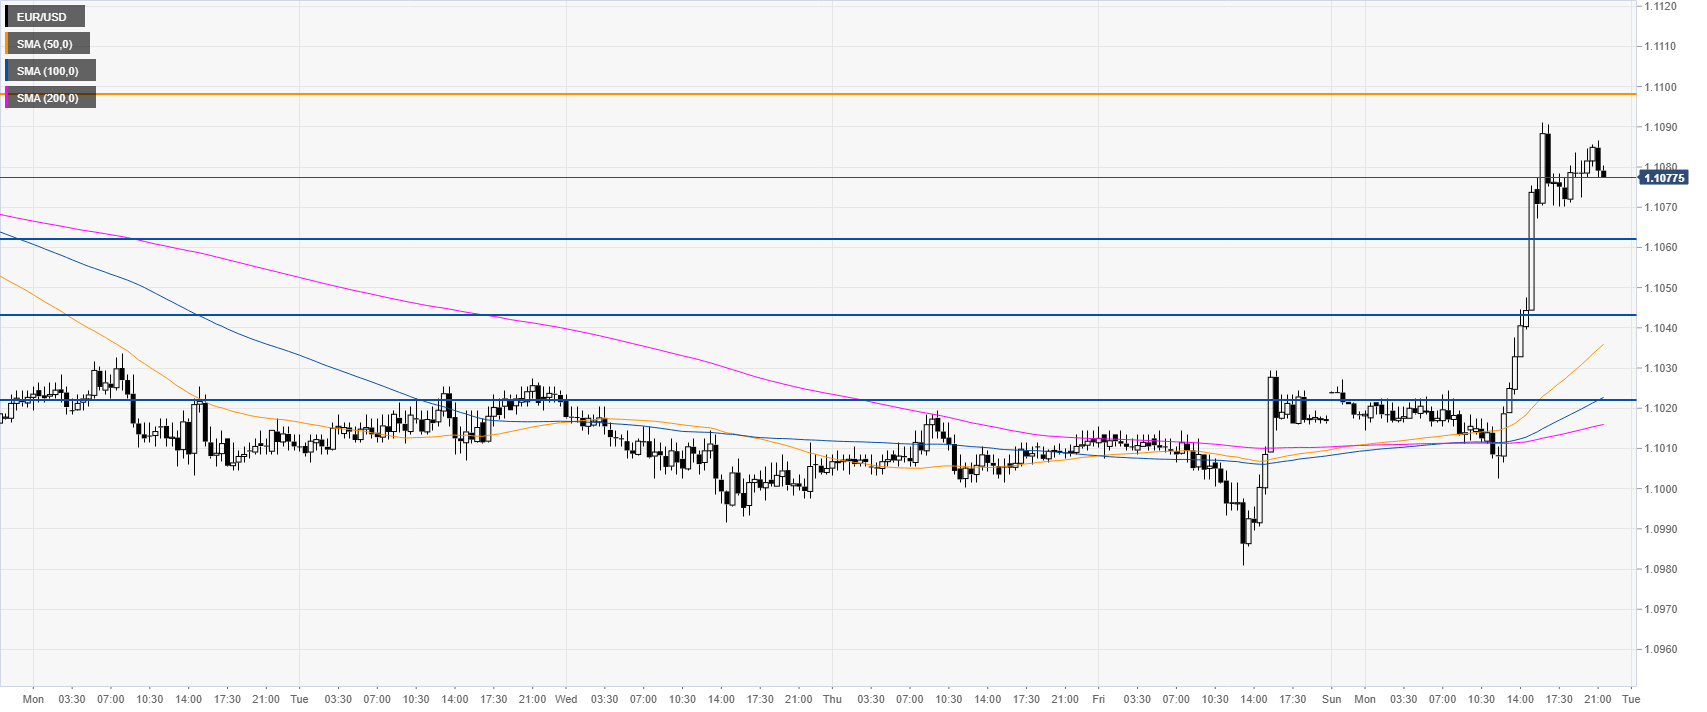
EUR/USD 30-minute chart
The spot had an unusually large bullish breakout this Monday. Support can be seen at the 1.1062, 1.1045 and 1.1022 price levels, according to the Technical Confluences Indicator.
Additional key levels