Back
26 Nov 2019
AUD/USD Technical Analysis: Aussie rolls into the Asian session clinging to modest daily gains near 0.6790 level
- The aussie ends Tuesday on its highs, although the market stays in a limited range.
- The level to beat for bears is the 0.6773 support.
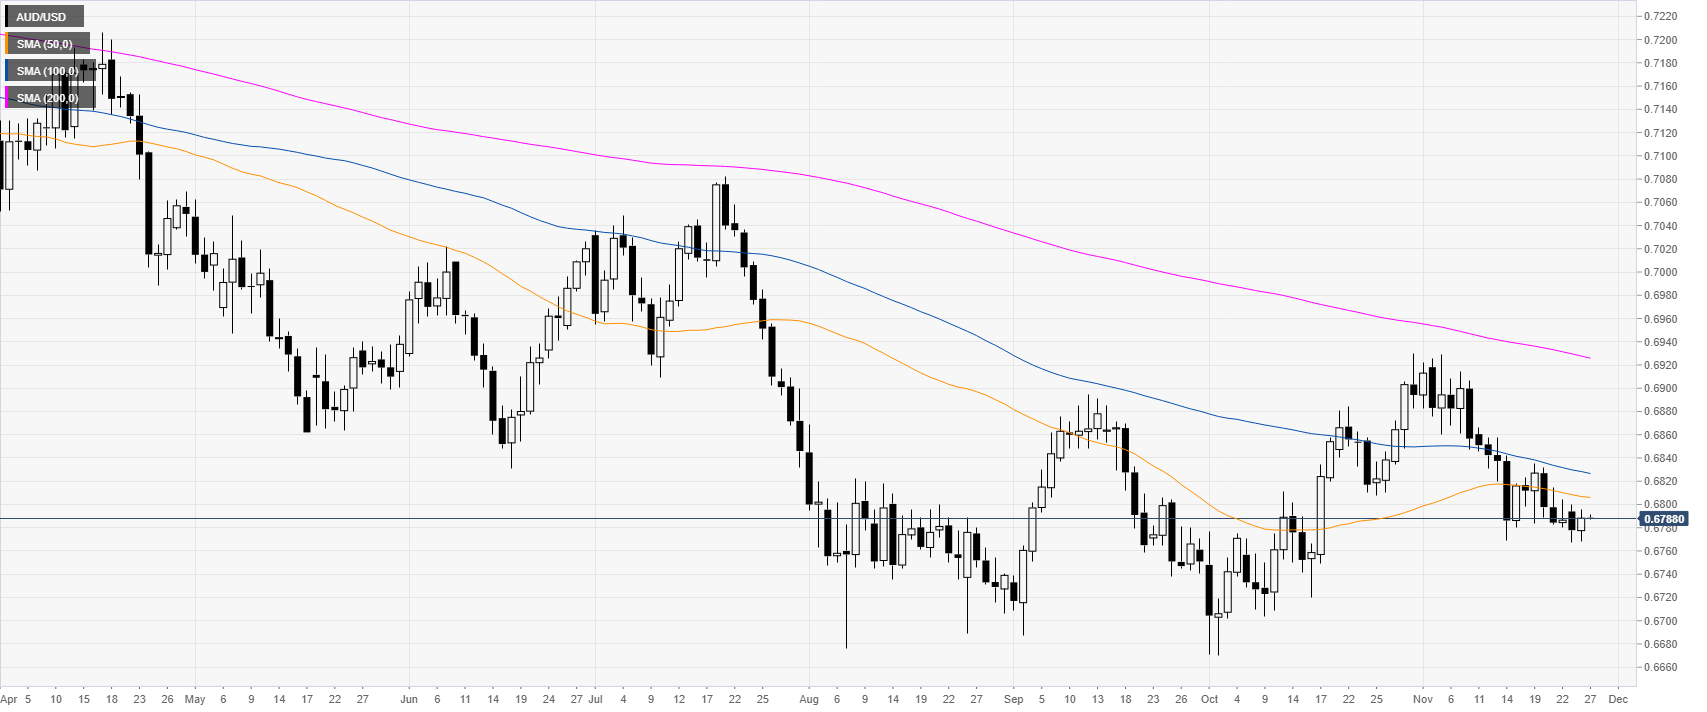
AUD/USD daily chart
The aussie is trading in a downtrend below the main daily simple moving averages (DMAs) on the daily time frame chart. The market is holding above the November lows.
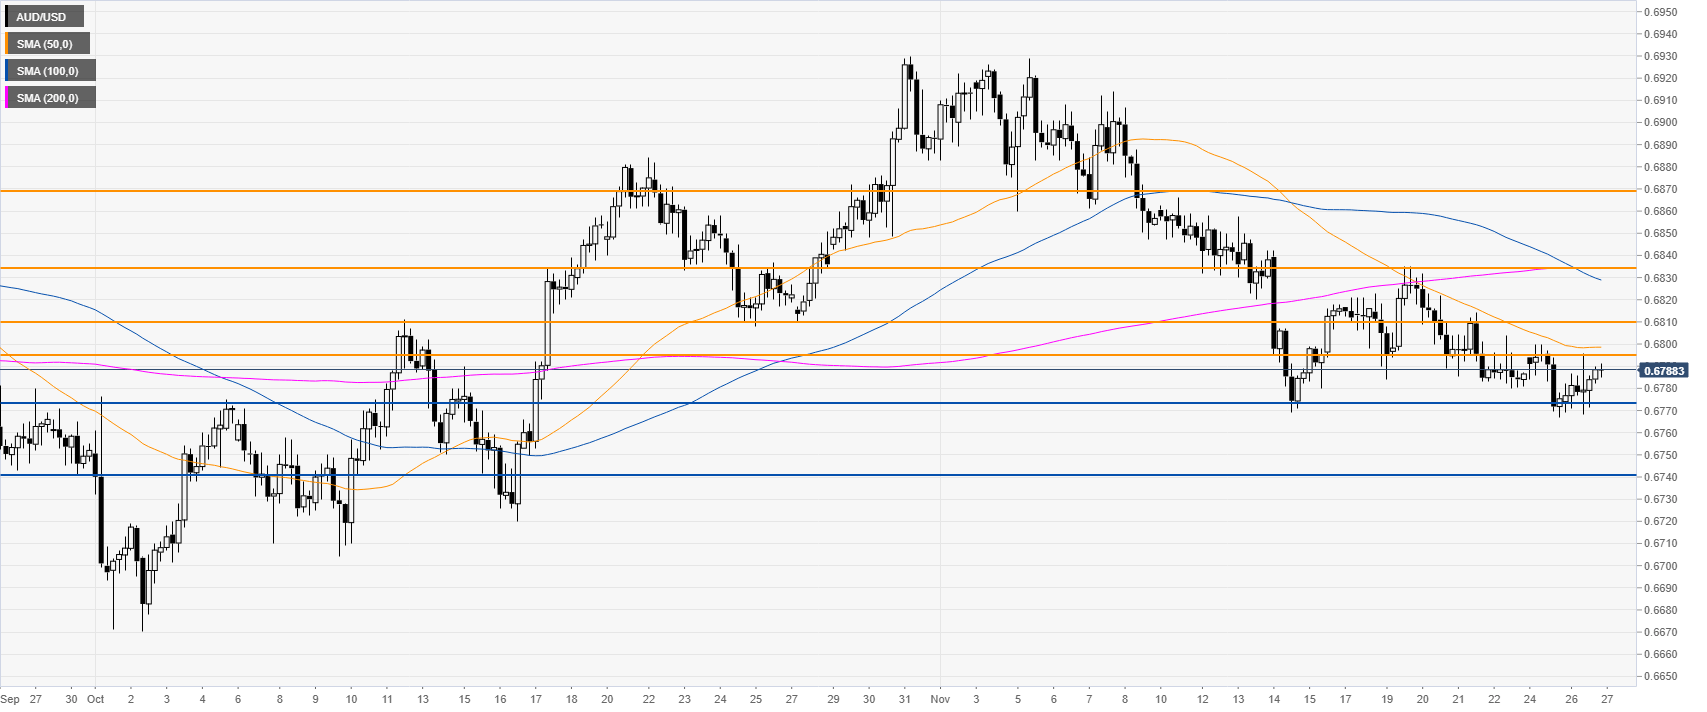
AUD/USD 4-hour chart
The spot is bouncing mildly from the November lows. If the market breaks below the 0.6773 (swing low), the sellers could drive the market down to the 0.6740 level, according to the Technical Confluences Indicator.
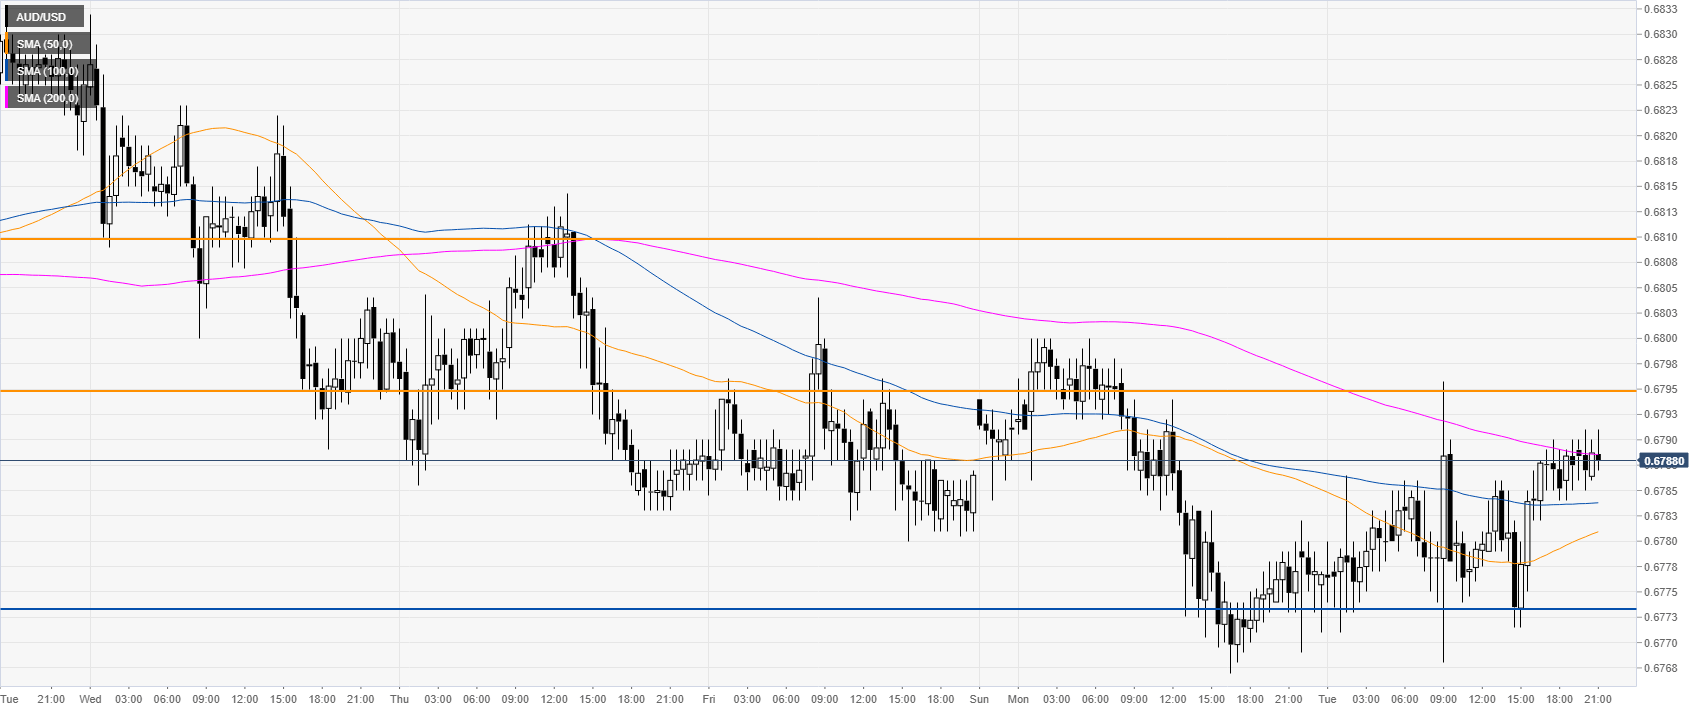
AUD/USD 30-minute chart
AUD/USD is trading below the 0.6795 resistance and a downward sloping 200 SMAs, suggesting a bearish bias in the short term. If 0.6795 is broken to the upside, the market could correct towards the 0.6810 price levels, according to the Technical Confluences Indicator.
Additional key levels