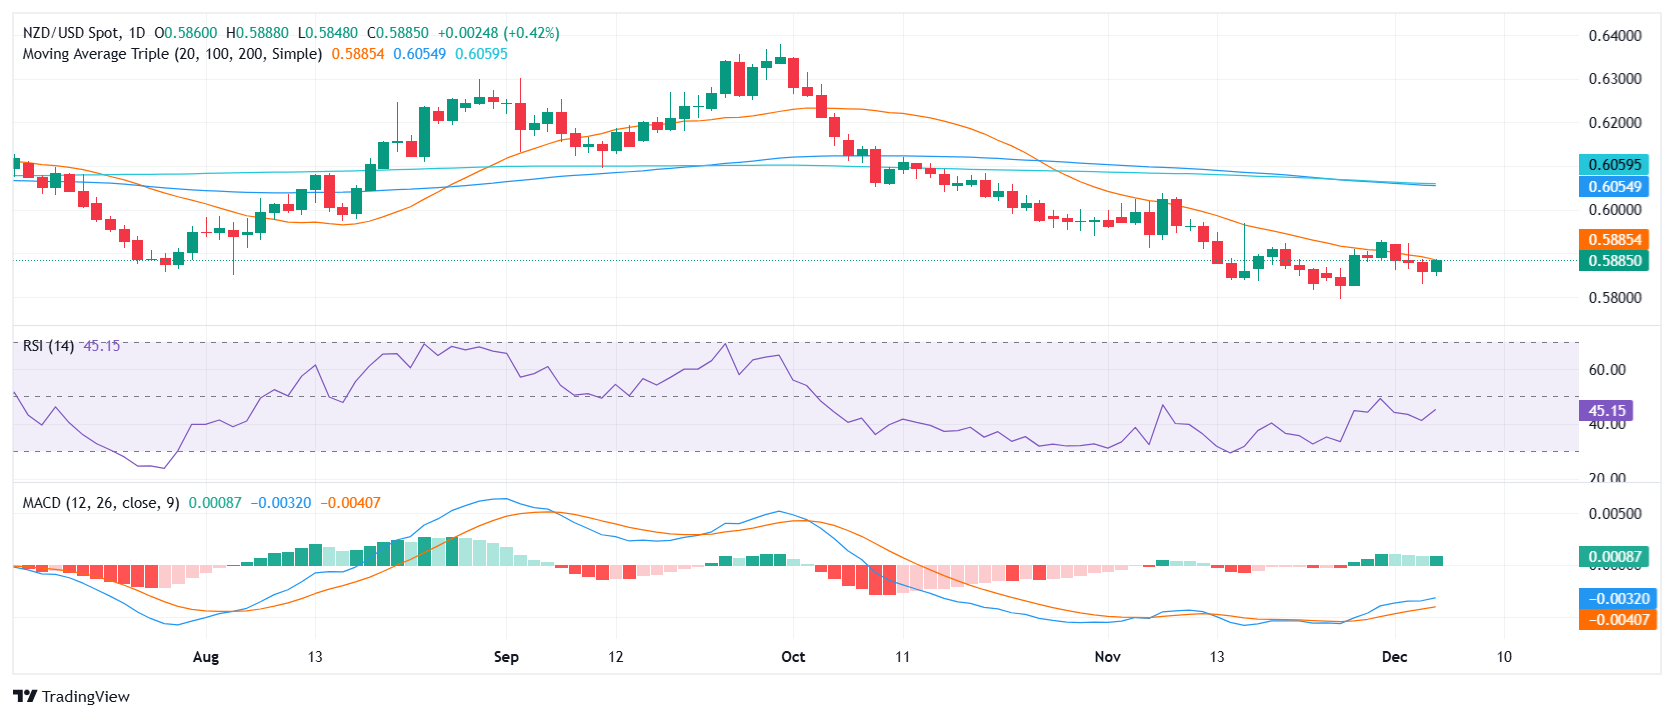
NZD/USD Price Analysis: Gains capped below the 20-day SMA
- NZD/USD rises 0.40% on Thursday, approaching 0.5890.
- The pair remains capped by the 20-day SMA, limiting bullish momentum.
- Technical indicators show slight improvement but no clear reversal signals.
The NZD/USD pair edged higher on Thursday, gaining 0.15% to trade near 0.5890. Despite this upward move, the pair continues to face strong resistance at the 20-day Simple Moving Average (SMA), a level that remains unconquered and keeps the broader outlook tilted to the downside.
Technical indicators are offering a mixed picture. The Relative Strength Index (RSI) has gained some ground, moving closer to neutral levels, suggesting slight easing of selling pressure. Meanwhile, the Moving Average Convergence Divergence (MACD) histogram has turned slightly more positive, with green bars hinting at improving momentum. However, neither indicator provides clear signals of a sustained reversal, keeping traders cautious.
For the bulls to regain control, NZD/USD needs to decisively break above the 20-day SMA, which is currently acting as a key resistance level. Until this level is reclaimed, the outlook will remain bearish. On the downside, any renewed selling pressure could push the pair back towards support at 0.5860 and the psychological 0.5800 level.

