Silver Price Analysis: XAG/USD plummets to a two-month low, below the 200-day EMA
- XAG/USD sinks below key $22.96, the 200-day EMA level.
- Bearish RSI and RoC indicate a strong sell-off, warranting further XAG/USD downside.
- XAG/USD upside resistance was found at a $23.00 handle, followed by a challenge of the 100-day EMA.
Silver price pierces below the 200-day Exponential Moving Average (EMA) of $22.96 as sellers pile in, dragging prices towards a new two-month low of $22.50, as high US Treasury bond yields pressure the precious metals segment. At the time of writing, XAG/USD trades at $22.75, while Gold (XAU/USD) spot exchanges hands at $1931.02, down 1.64% and 0.23%, respectively.
Risk-off sentiment is weighing on the precious metals segment. Investors remain uncertain as the Fed Chair Jerome Powell commences his two-day testimony at the US Congress, which you can follow here. The US 10-year Treasury note yields 3.775% and gains 4.6 bps, while US real yields, directly influencing XAG/USD’s prices, climb five bps to 1.555%.
XAG/USD Price Analysis: Technical outlook
The XAG/USD remains neutral to downward biased, though it could shift to the downside if XAG/USD prints a daily close below the May 25 swing low of $22.68. That would mean the Silver price breaking the 200-day Exponential Moving Average (EMA) threshold and, from a technical perspective, turning XAG/USD bearish.
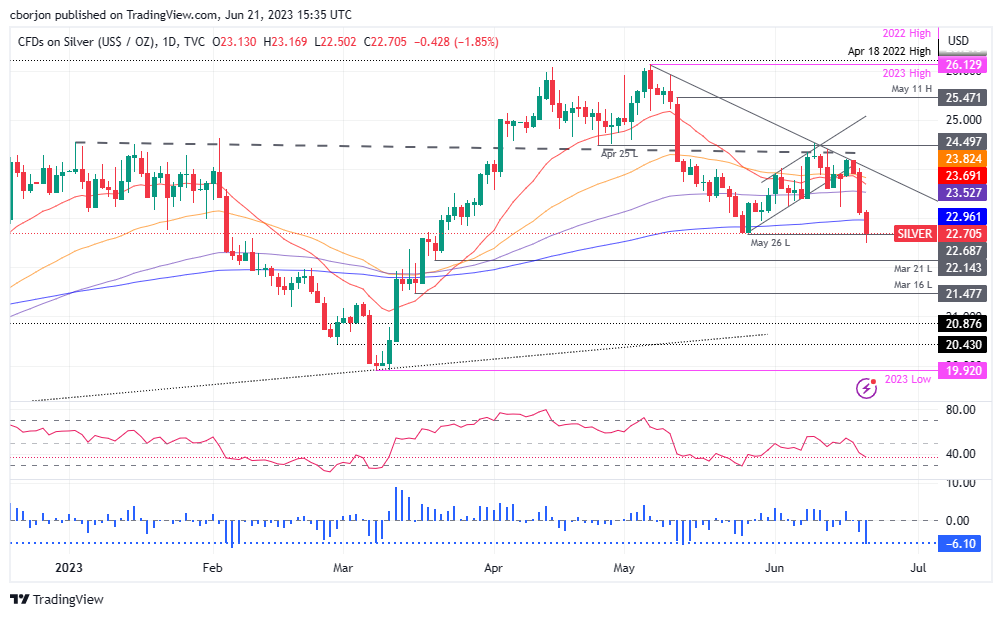
Further cementing XAG/USD bearish case is the Relative Strength Index (RSI) indicator at negative territory, while the three-day Rate of Change (RoC) continues to plunge as sellers gain momentum.
That said, in that outcome, XAG/USD could dive towards the March 21 daily low at $22.14 before challenging the $22.00 figure. A breach of the latter will expose the March 16 low at $21.47, followed by the $21.00 mark.
Conversely, if XAG/USD reclaims the 200-day EMA, that could expose the $23.00 handle on the upside, followed by the 100-day EMA at $23.52.
XAG/USD Price Action – Daily chart