NZD/USD Price Analysis: Weekly support, 200-HMA challenge bears around 0.5650
- NZD/USD sellers attack short-term key support, extends the previous day’s pullback from weekly top.
- Eight-day-old rising wedge formation joins bearish MACD signal to keep bears hopeful.
- 200-HMA adds to the downside filters, bulls need validation from the monthly top.
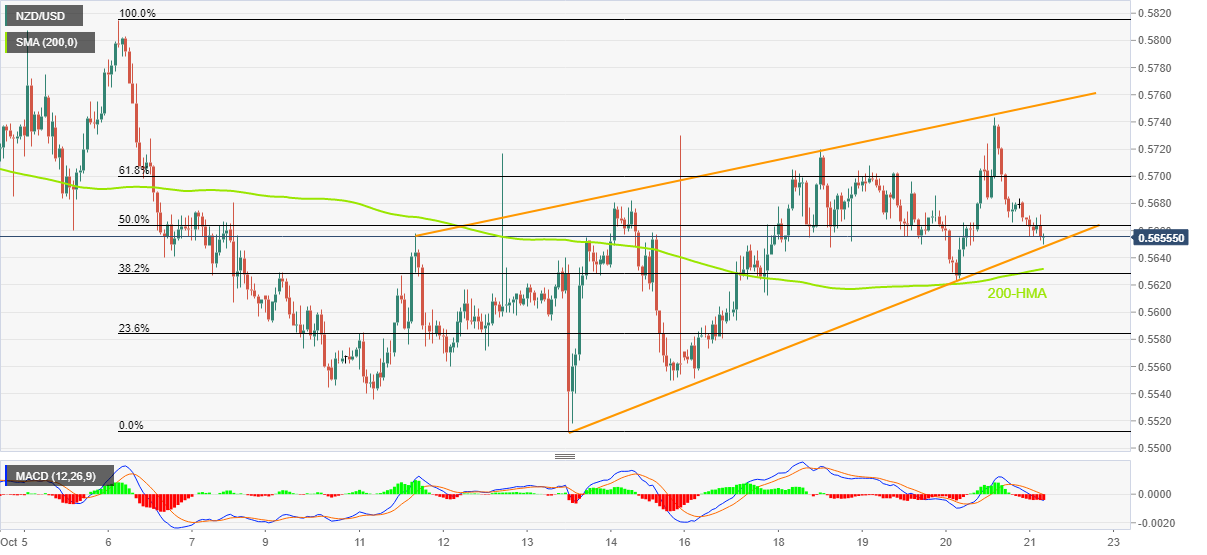
NZD/USD appears all set to confirm a one-week-old bearish chart pattern called a rising wedge as sellers poke the support line around 0.5650 heading into Friday’s European session.
The kiwi pair refreshed the weekly top before reversing from 0.5743. Even so, the quote stays on the way to the biggest weekly gains since early August.
Not only the rising wedge but bearish MACD signals also keep the NZD/USD sellers hopeful of breaking the support near the mid-0.5600s. Even so, the 200-HMA level of 0.5631 acts as an extra filter towards the south before welcoming the bears.
Following that, the yearly low of 0.5511 marked in the last week could offer an intermediate halt during the theoretical target surrounding the 0.5400 mark.
Alternatively, recovery moves may initially aim for the 61.8% Fibonacci retracement of October 03-13 downside, near 0.5700, before approaching the stated wedge’s upper line, close to 0.5755 by the press time.
It should be noted that the NZD/USD pair’s run-up beyond 0.5755 needs validation from the monthly high of 0.5815 to convince the buyers.
NZD/USD: Hourly chart
Trend: Further weakness expected